
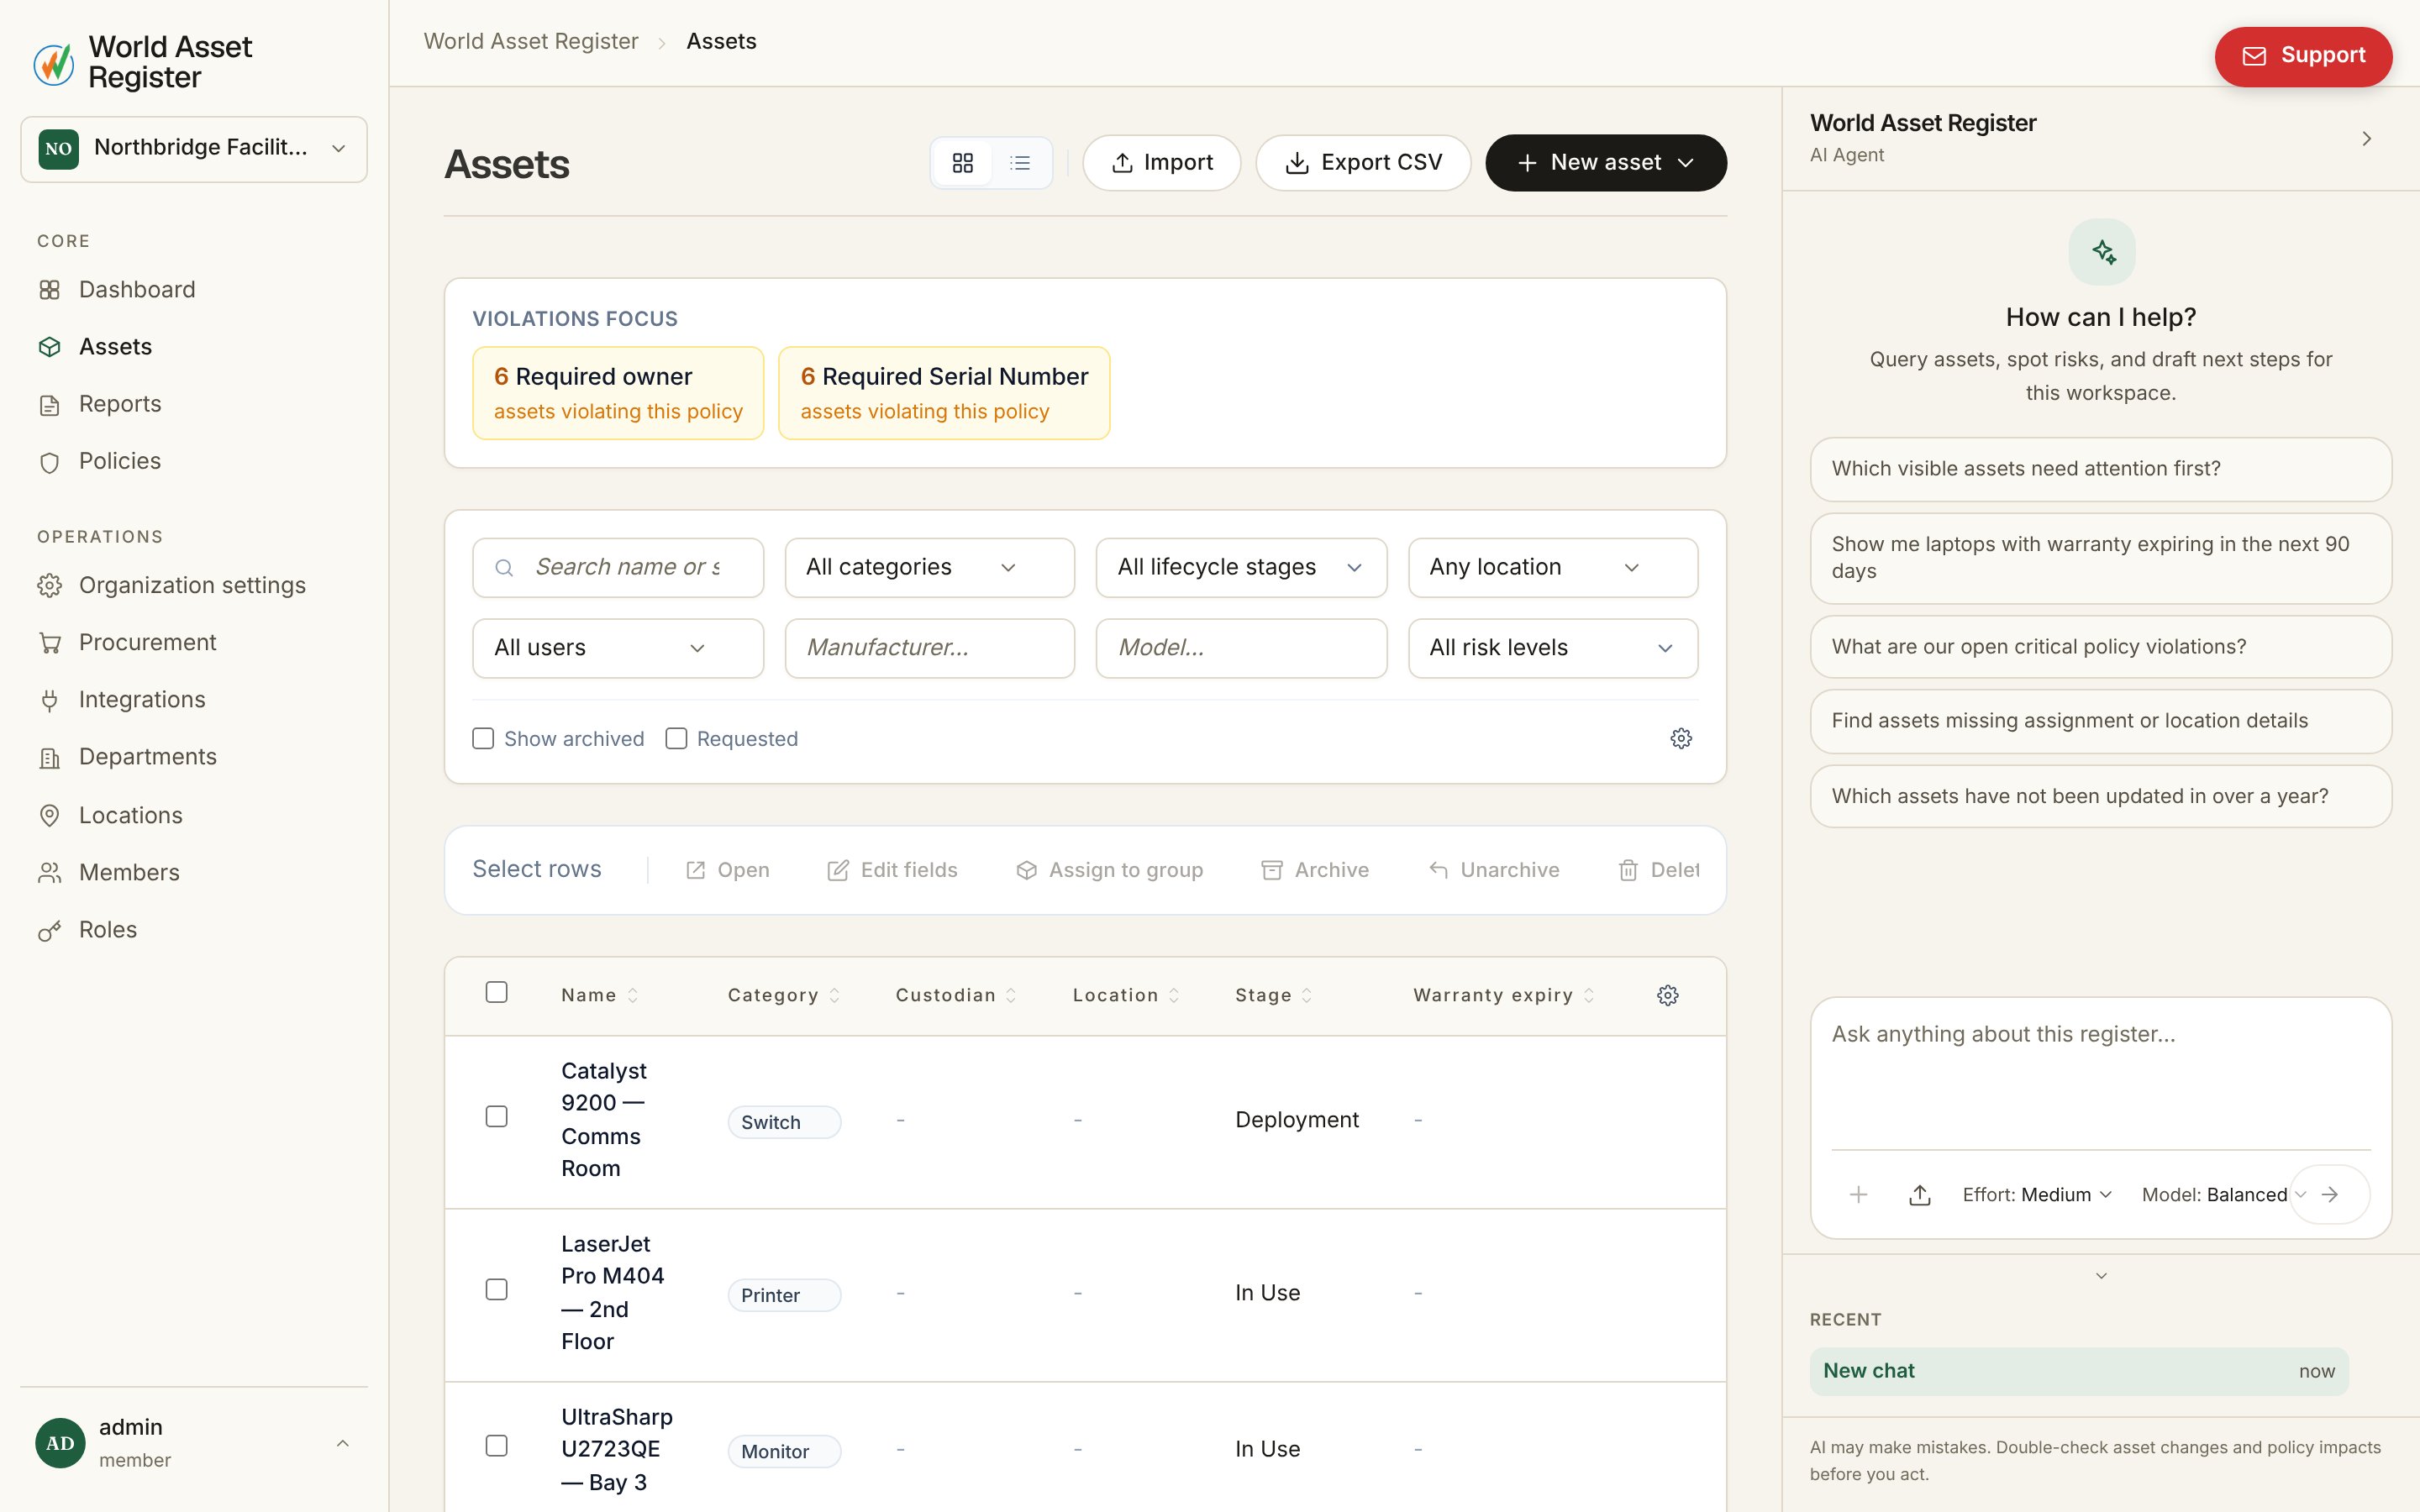
Two ways to view it
The toggle at the top right switches between two layouts:- Card view: a visual grid, one card per asset. Best for browsing and for teams that recognise things by sight.
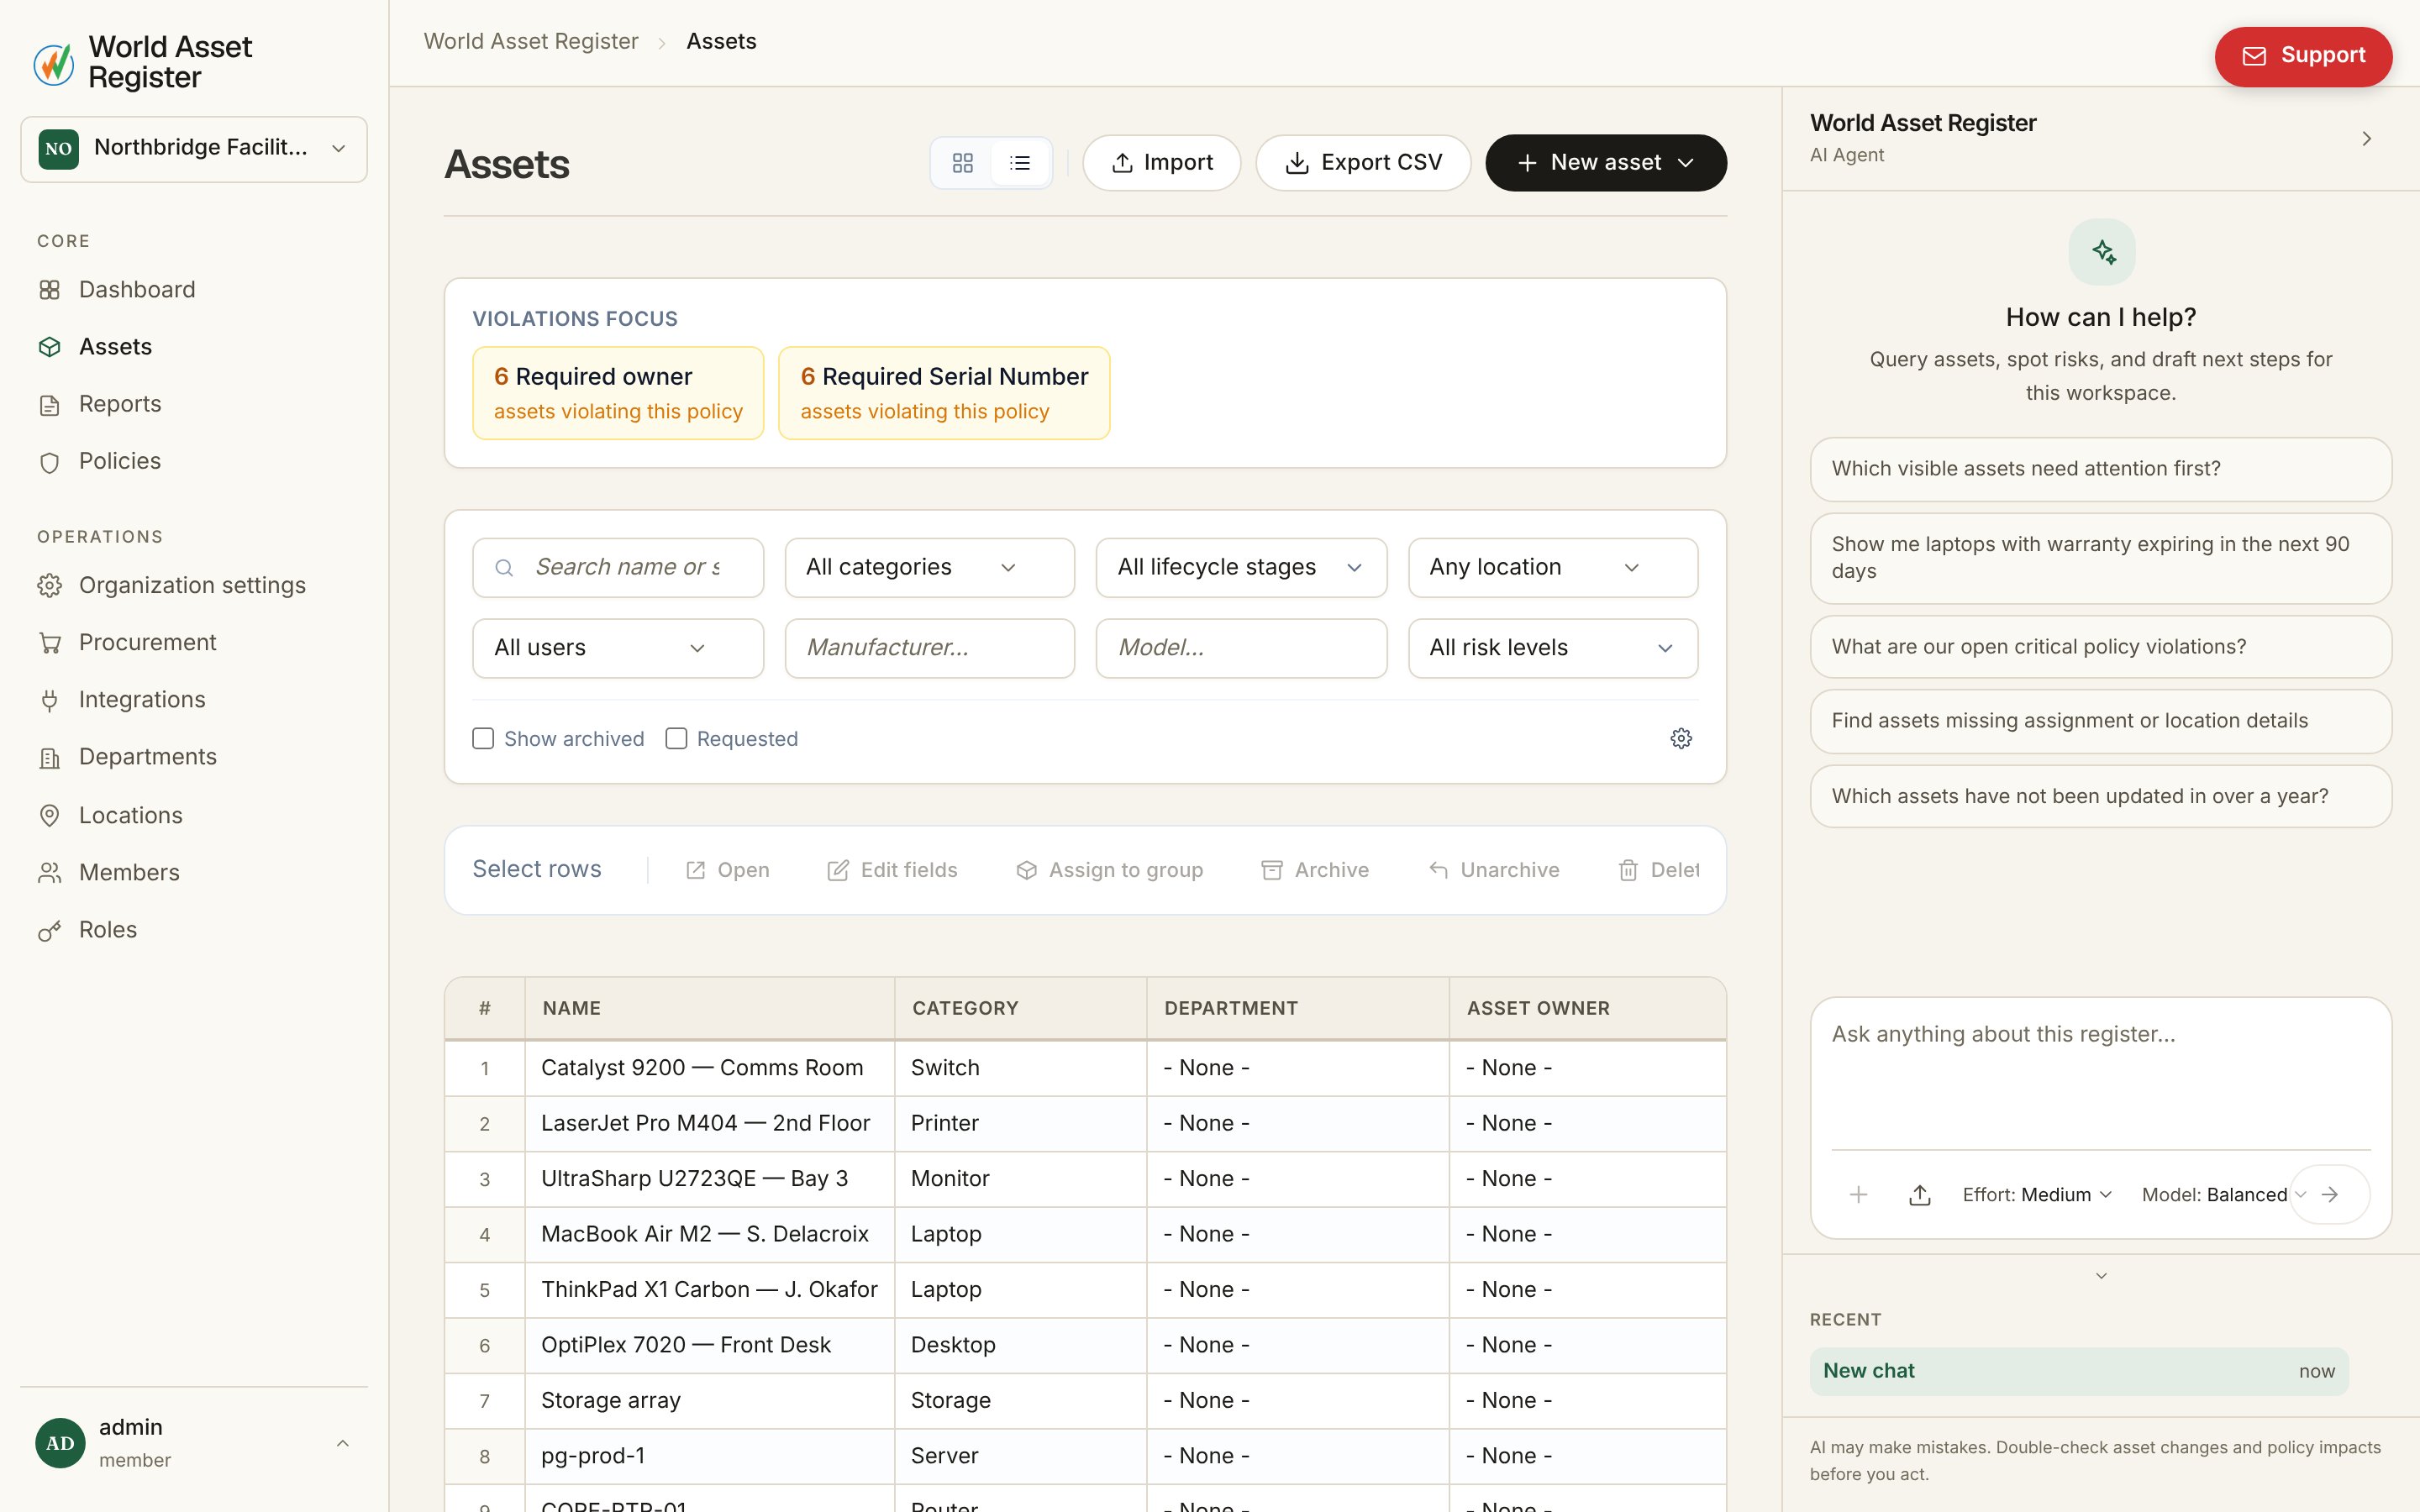
- Spreadsheet view: a dense, editable grid. Click a cell to edit it in place, move around with Tab and Enter, and double-click the blue handle on a selected cell to fill its value down the column. It works exactly like a spreadsheet, except every change is saved, validated and audit-logged. Columns you don’t have permission to edit simply aren’t editable.
Finding things
Every field on an asset can be searched or filtered, built-in fields and your own custom fields alike.- Search matches against name and serial number, the two things people actually have in hand. For text matching on any other field, add that field as a filter.
- Filters live in a row above the list. Each filter is typed to its field. Number and currency fields filter by range, dates by period, people and locations by picking from your directory, multi-select fields by choosing one option to find everything that carries it. Use the edit filters control to add or remove filter slots, so the row shows exactly the filters your team actually uses.
- Group chips: if you’ve created asset groups (say Head office refresh 2026 or Loan pool), they appear as coloured chips. Click one to see just that group’s assets.
- Violation chips: when a policy currently has violations, a chip appears for it. Click it to see exactly the assets breaking that rule.
Columns and sorting
The columns are yours to choose. Add any field, including custom fields and the structural Added and Last updated dates, from the add column control, and drop the ones you don’t need. Name and Category always stay. Click a column heading to sort (numbers and currencies sort numerically, dates chronologically, people and locations by name). Pages show 20, 50, 100 or 500 assets at a time.Adding assets
The New asset button offers four ways in, fastest first: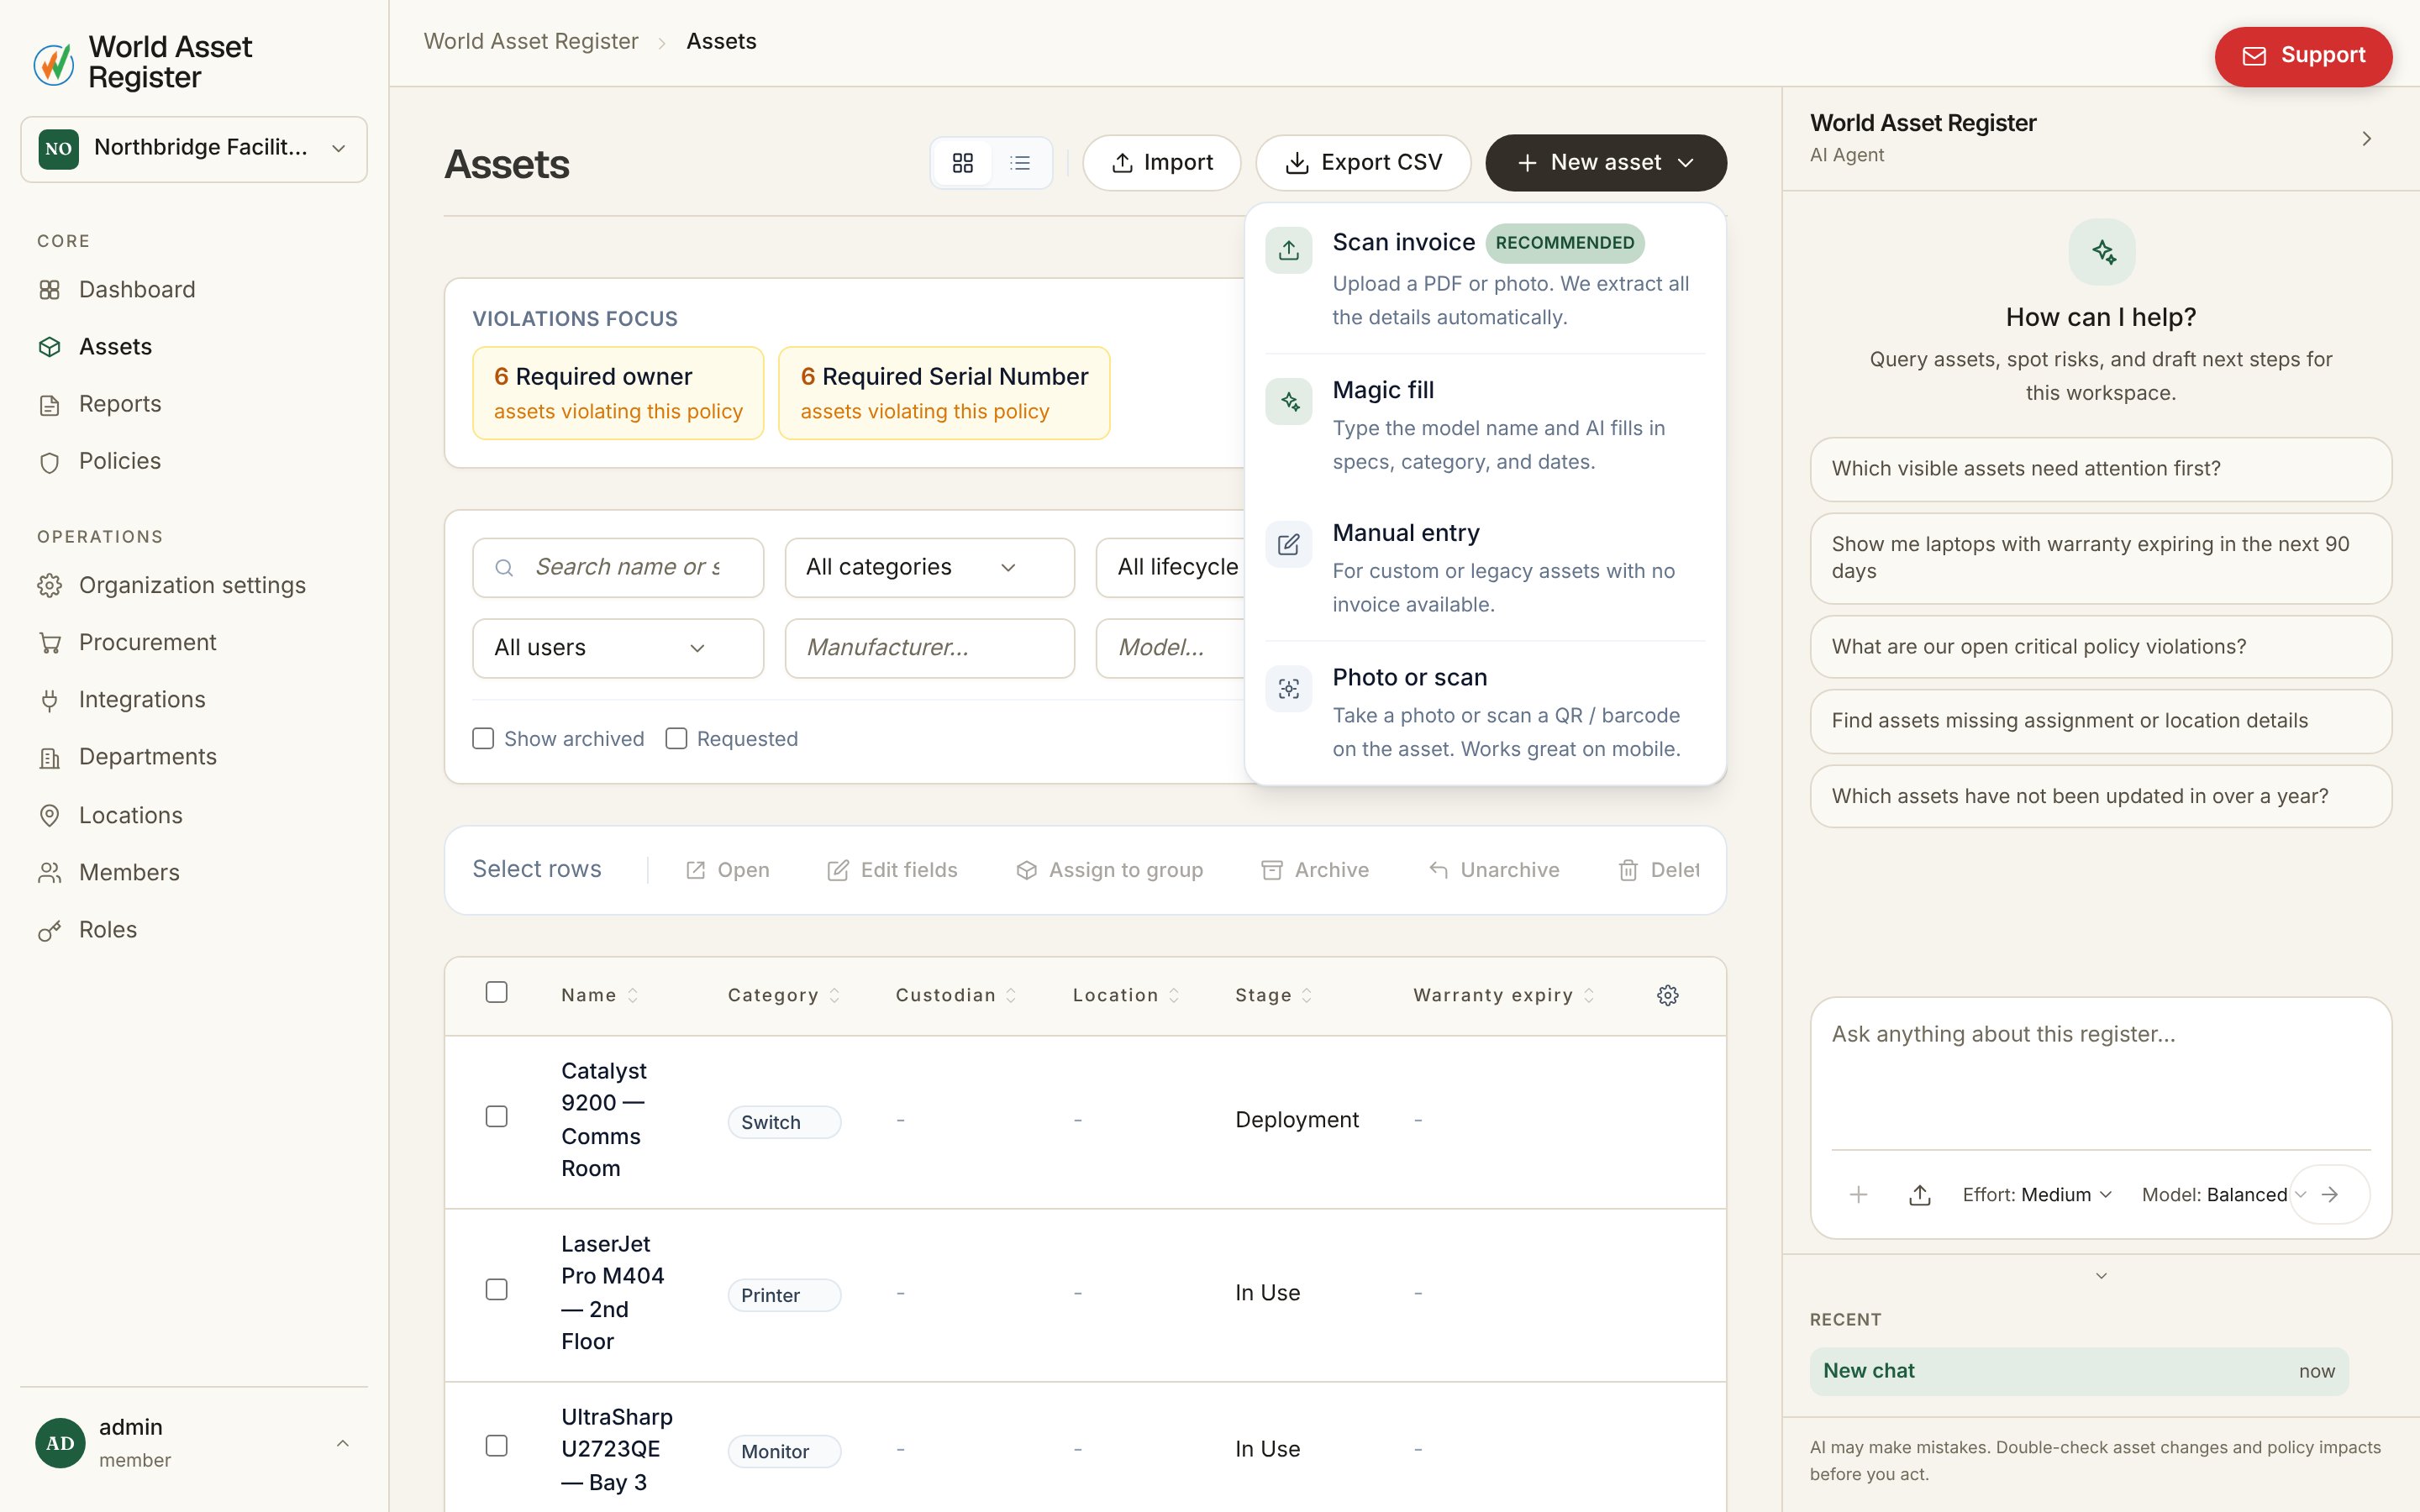
- Scan invoice (recommended): upload a supplier invoice as a PDF or photo. The details (items, costs, dates, supplier) are extracted automatically into draft assets for you to review.
- Magic fill: type a model name (“ThinkPad X1 Carbon Gen 12”) and AI fills in the specifications, category and typical dates for you.
- Manual entry: the classic form, for custom or legacy assets with no paperwork.
- Photo or scan: take a photo of the asset, or scan a QR code or barcode already on it. Works great on a phone, which is usually where you are when you find an unregistered asset.